Physical Sales Graph For The Past 20 Years Highlights Just How Much Gaming Has Changed
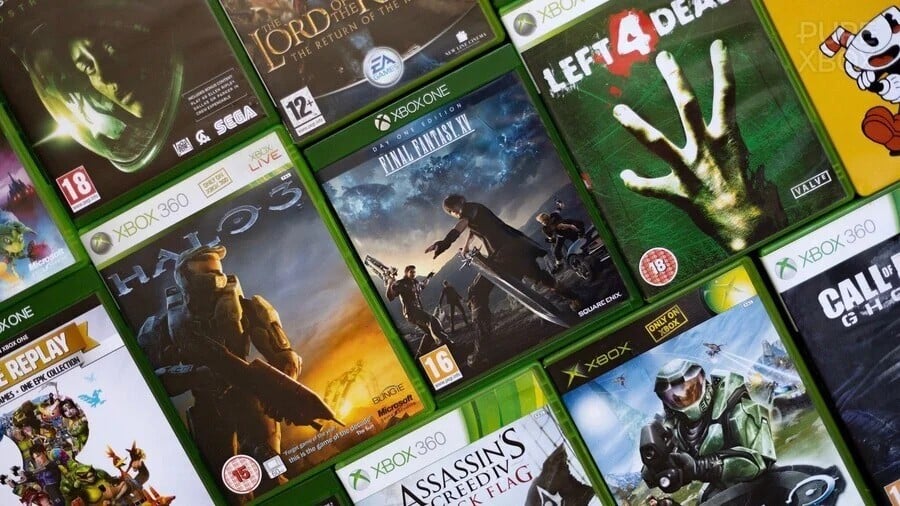
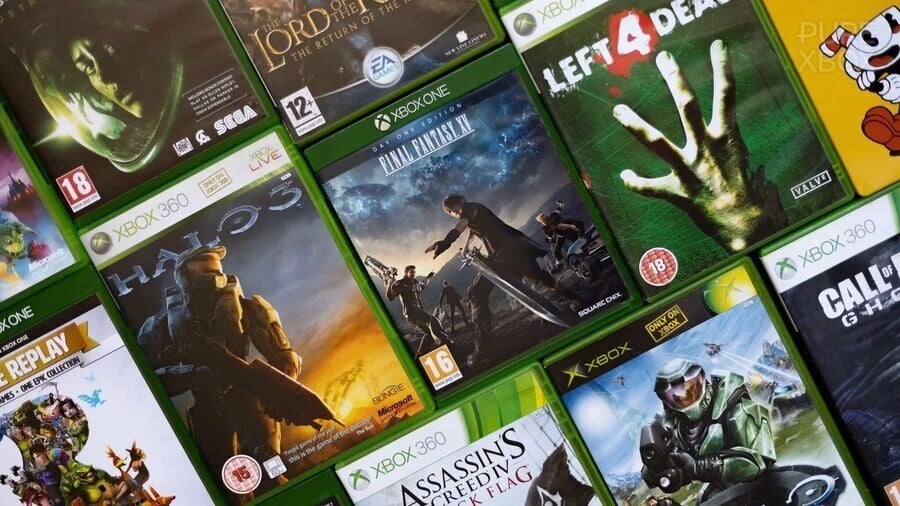
There’s been a lot of pressure on Xbox to continue supporting physical games following PlayStation’s decision to pull out of them from 2028 onwards, but we also know that physical sales have suffered on Xbox for a long time.
Indeed, they’ve suffered across multiple platforms for a long time, as evidenced by a Circana graph that’s been getting some attention on social media. The graph tracks physical sales in the United States alone, but nevertheless shows the intense drop-off of those sales since 2009, and particularly since the Xbox One and PS4 launches in 2013.
Here’s a look at the image in detail, and then we’ll add the accompanying posts that were first shared last month:

Of course, this is taking Xbox, PlayStation and Nintendo Switch into account, and the Xbox data would read significantly worse. Xbox sells far less physical games than those other two platforms, and has done so for many years now.
So again, this begs the question of whether Xbox actually should cater to the idea of supporting physical games to “get one up” on PlayStation, or whether they should accept the apparent reality that physical sales will only continue trending downwards over the next decade.
Sony has made this a difficult question to answer, but we reckon if they hadn’t said anything, Xbox wouldn’t have even thought twice about ditching physical in the years to come. For now though, perhaps there’s still hope for fans of discs when it comes to Xbox’s Project Helix console, and fingers crossed we’ll get clarity on it either way ASAP.